
The South Cambs average rose £845 in a year to £441,410 in August, while Cambridge fell £10,508. July's 2.2% rise has been revised down to 0.7%.
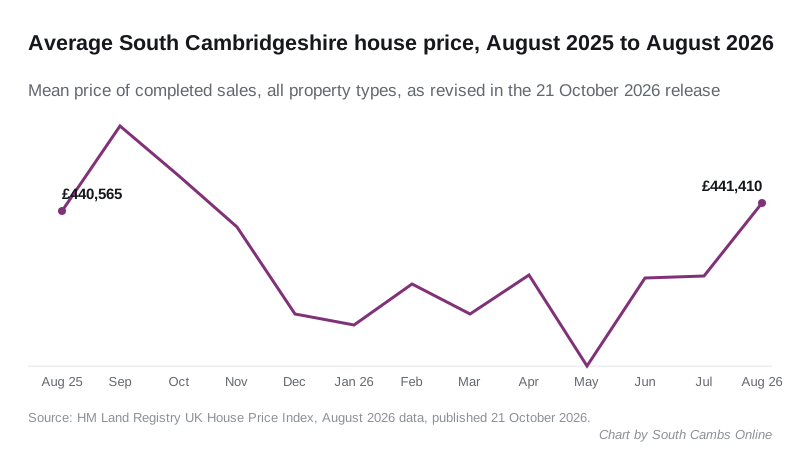
The average South Cambridgeshire home sold for £441,410 in August. A year earlier it was £440,565, so the district has gained £845 in twelve months, a rise of 0.2%.
Cambridge went the other way. The city average fell £10,508 over the same year, to £470,360. That is a drop of 2.2%, and the biggest fall of any district in Cambridgeshire.
The figures come from the UK House Price Index, which HM Land Registry published this morning. The index is built from completed sales, not asking prices. It reports a mean average, not a median, so a few large village sales can pull it up.
A strong month inside a flat year
August on its own was a good month. The average rose £8,172 on July, or 1.9%.
Set against the whole year, it looks different:
- September 2025 remains the district’s record, at £449,954 on the revised figures.
- May 2026 was the low point of the past year, at £423,275.
- August 2026 is £18,135 above May, but still £8,544 below last September.
Over three and a half years the picture is flatter still. The index is set so that January 2023 equals 100, when the average was £427,057. August’s reading is 103.4: a rise of £14,353 in total.
July has been revised down
When the July figures came out on 16 September, Land Registry put the district average at £439,573, up 2.2% on the year. We reported that figure.
Today’s release revises July to £433,238, a cut of £6,335. The annual rise for July is now 0.7%, not 2.2%.
This happens every month. Recent months are estimated from the sales registered so far, and they move as late completions come in. August’s £441,410 is likely to move too. Our July article now carries a dated note.
Flats are still falling
Two of the four property types rose over the year, and two fell.
| Type | August 2026 | Annual change |
|---|---|---|
| Detached | £635,858 | down 0.5% |
| Semi-detached | £406,744 | up 1.4% |
| Terraced | £331,993 | up 1.0% |
| Flat or maisonette | £200,909 | down 2.4% |
The average flat in the district was worth £204,590 in August 2017. It is now £200,909: £3,681 less than nine years ago, before inflation is taken into account. The flat average was higher in August 2022, at £209,305.
The gap with Cambridge has narrowed sharply
The usual reason to look outside the city is price. On these figures the saving is shrinking fast:
- August 2025: Cambridge £480,868, South Cambridgeshire £440,565, a gap of £40,303
- August 2026: Cambridge £470,360, South Cambridgeshire £441,410, a gap of £28,950
That is £11,353 off the gap in a single year. It comes almost entirely from the city falling rather than the villages rising.
Across Cambridgeshire and the neighbours
| Area | August 2026 | Annual change |
|---|---|---|
| Cambridge | £470,360 | down 2.2% |
| South Cambridgeshire | £441,410 | up 0.2% |
| East Cambridgeshire | £340,059 | up 2.0% |
| Huntingdonshire | £306,954 | up 1.1% |
| Peterborough | £231,634 | down 1.3% |
| Fenland | £224,770 | up 2.9% |
| Uttlesford | £468,166 | up 0.1% |
| North Hertfordshire | £422,835 | up 3.1% |
| West Suffolk | £295,860 | down 0.5% |
South Cambridgeshire is still the second dearest district in the county, behind Cambridge. Across the border, Uttlesford, which takes in Saffron Walden, is now only £2,194 cheaper than Cambridge on average. North Hertfordshire, which includes Royston, rose fastest of the neighbours.
For comparison, England rose 0.4% to £293,525 and the East of England 0.2% to £337,848.
What it means for you
- If you are buying in the villages, prices are where they were a year ago. The district average has moved less than £1,000 in twelve months.
- If you are moving out of Cambridge, the saving on an average home has fallen from about £40,000 to about £29,000 in a year.
- If you are a first-time buyer, the district’s first-time buyer average is £350,694, up 0.5% on the year. England’s is £246,042, so you need £104,652 more here.
- If you are selling a flat, the market is still against you. Price against recent completed sales, not last year’s asking prices.
- If you are checking your own street, this is a district-wide mean. One village can move quite differently, and the last three months are provisional.
Our standing page on South Cambridgeshire house prices has the longer picture, and council tax bands has what each band costs by parish.
Revision note, 18 November 2026: HM Land Registry’s September release revised the August figures in this report. August 2026 now reads £438,037, a fall of 0.6% on a year, rather than the £441,410 and 0.2% rise published on 21 October and reported above. September 2025 now reads £450,041. The latest figures are in our September 2026 report.
Have your say