
The South Cambs average fell 3.3% in a year to £435,108 in September, the biggest fall in Cambridgeshire. Every type of home is cheaper than a year ago.
The average South Cambridgeshire home sold for £435,108 in September. That is £14,933 less than a year earlier, a fall of 3.3%.
It is the biggest annual fall of any district in Cambridgeshire, and the district’s sharpest since March 2024.
The comparison is with a peak. September 2025, at £450,041, is still the highest monthly average the district has recorded.
The figures come from the UK House Price Index, which HM Land Registry published this morning. The district numbers are in the full data file. The index is built from completed sales, not asking prices. It reports a mean average, not a median, so a handful of large village sales can move it.
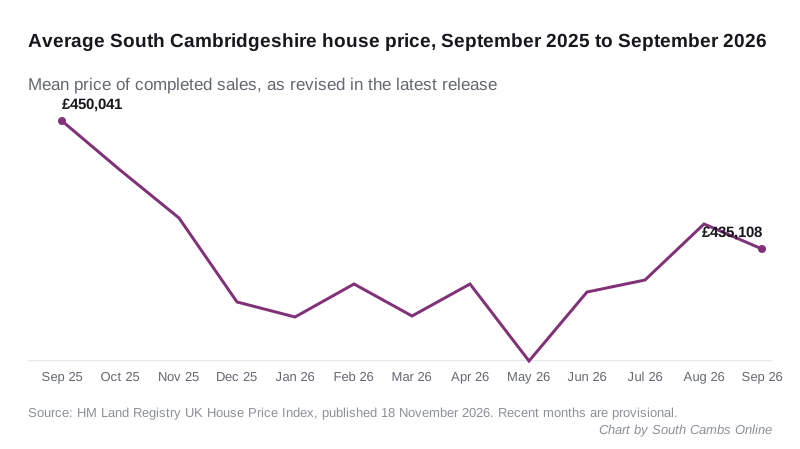
A small dip after a summer recovery
On the month, the average fell £2,929, or 0.7%, from August’s revised £438,037.
The past year has three clear points:
- September 2025: the record, at £450,041
- May 2026: the low point, at £422,039
- September 2026: £13,069 above May, but £14,933 below the record
August has been revised down
When the August figures came out on 21 October, the district average was £441,410, up 0.2% on the year. We reported that figure.
Today’s release revises August to £438,037. The annual change for August is now a fall of 0.6%, not a rise.
Recent months are estimated from the sales registered so far, and they move as late completions are added. September’s figure will probably move too. Our August article now carries a dated note.
Every type of home is cheaper than a year ago
| Type | September 2026 | Annual change |
|---|---|---|
| Detached | £628,993 | down 3.6% |
| Semi-detached | £400,269 | down 2.4% |
| Terraced | £326,112 | down 3.0% |
| Flat or maisonette | £197,177 | down 5.9% |
Flats fell furthest, as they did in August.
Buyers with and without a mortgage paid less alike. Cash buyers paid an average of £444,943, down 3.5%. Mortgage buyers paid £431,505, down 3.2%.
The gap with Cambridge has opened up again
In August the saving from buying outside the city had shrunk to about £29,000. September’s figures put it back near £38,000:
- September 2025: Cambridge £479,392, South Cambridgeshire £450,041, a gap of £29,351
- September 2026: Cambridge £473,590, South Cambridgeshire £435,108, a gap of £38,482
Both fell over the year. The villages simply fell further.
Across Cambridgeshire and the neighbours
| Area | September 2026 | Annual change |
|---|---|---|
| Cambridge | £473,590 | down 1.2% |
| South Cambridgeshire | £435,108 | down 3.3% |
| East Cambridgeshire | £341,531 | down 0.4% |
| Huntingdonshire | £308,104 | up 1.3% |
| Peterborough | £232,703 | down 1.3% |
| Fenland | £223,031 | up 2.9% |
| Uttlesford | £465,802 | down 0.5% |
| North Hertfordshire | £426,862 | up 2.2% |
| West Suffolk | £297,817 | up 0.4% |
South Cambridgeshire is still the second dearest district in the county, behind Cambridge. Uttlesford, which takes in Saffron Walden, is now £30,694 dearer than South Cambridgeshire on average.
For comparison, England rose 0.8% to £292,998, and the East of England rose 0.7% to £338,357.
What it means for you
- If you are buying, the average home costs about £15,000 less than at last autumn’s peak. Detached homes are down about £23,000 on a year ago, on these figures.
- If you are a first-time buyer, the district’s first-time buyer average is £345,566, down 3.1%. England’s is £245,052, so you still need £100,514 more here.
- If you are moving out of Cambridge, the saving on an average home is back to about £38,000.
- If you are selling, price against recent completed sales in your village, not last year’s figures. A record month is a poor benchmark.
- If you are checking your own street, this is a district-wide mean. One village can move quite differently, and the last three months are provisional.
The longer picture, including prices by village, is on our page on South Cambridgeshire house prices.
Have your say