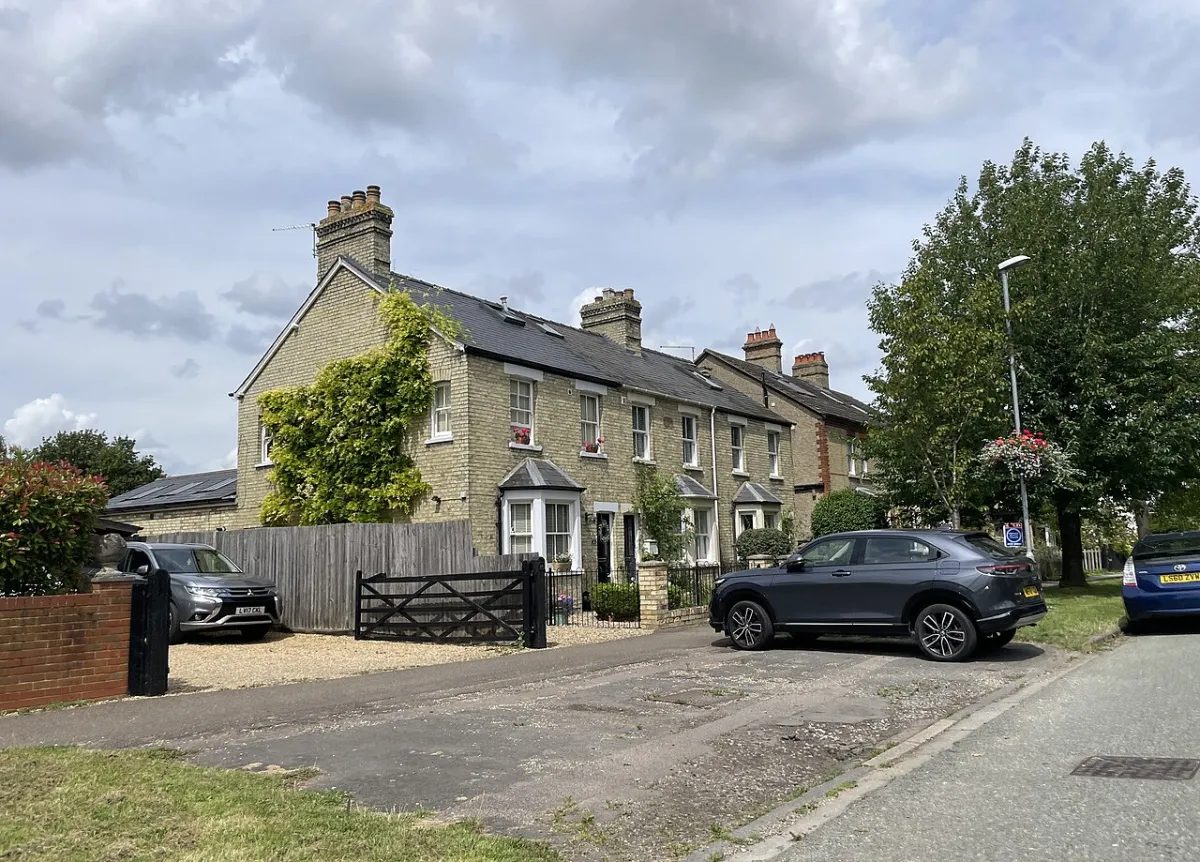

The average South Cambridgeshire home sold for £436,011 in June 2026, up 4.9% in a year. What each village costs, from Great Shelford's £890k to Cambourne's £381k.
Ask what a house costs in South Cambridgeshire and you will get a different answer in every village. The district is a ring of separate places around Cambridge, from new-build Cambourne to old-money Great Shelford, and the gap between them is now more than half a million pounds. This page sets out the official sold-price figures for the district, what each property type and each village actually costs, and how the area compares with Cambridge itself, all from HM Land Registry completed sales rather than asking prices.
The headline figure
The average home in South Cambridgeshire sold for £436,011 in June 2026, according to the official UK House Price Index, which is built from completed Land Registry sales. That is up 4.9% on a year earlier, a rise of £20,457, and well ahead of England’s 1.8%.
Two things stand out in the same data. First, the district is still cheaper than Cambridge city, where the average is £471,098, but the gap has narrowed sharply. It was £61,040 in June 2025 and is £35,087 now, because Cambridge fell 1.2% over the year while South Cambs rose. Second, the district sits roughly £97,000 above the East of England average and £143,000 above the England average, which is the price of being within reach of Cambridge’s jobs and stations.
Prices here have not simply climbed, though. The district’s record average was £451,901 in September 2025, and June is £15,890 below it. Our news report on the June figures sets out the month by month picture.
What each property type costs
The district average hides a wide spread by property type. These are the June 2026 figures from the UK House Price Index:
- Detached houses: £631,491 (up 4.3% on the year). The village family home that defines the district.
- Semi-detached houses: £399,838 (up 5.8%, joint strongest).
- Terraced houses: £326,010 (up 5.8%).
- Flats and maisonettes: £199,123 (up 2.9%, the weakest of the four).
The same dataset splits buyers too: a first-time buyer paid an average of £346,755, while a home mover trading up paid £514,919. The step from a first terrace to a village family house is, in effect, a £168,000 jump.
Village by village: from £381k to £891k
Because the district has no single town, village-level sold prices tell you more than the district average. These are Rightmove’s averages of actual sales over the twelve months to August 2026. They are raw averages of a small number of sales, so a few large detached sales can swing a village’s figure; treat them as a guide to the pecking order rather than precise valuations.
- Great Shelford, £890,632, is the clear outlier: detached homes averaged £1,552,753 over the year, and the village average jumped 26% on the back of those big sales. It is the closest thing the district has to a millionaire’s row.
- Histon (£520,194) is the priciest of the northern villages, helped by the busway and the science parks on its doorstep.
- The middle of the table, Melbourn, Comberton, Sawston, Linton and Waterbeach, all cluster between about £436,000 and £470,000.
- Cambourne, £380,569, is the cheapest of the villages checked and the only one down meaningfully on the year (5%). As a new town of modern estates it has the youngest housing stock in the district, and it is where first-time buyers get the most house for the money.
How South Cambs compares
| Area | Average price | Change over 12 months |
|---|---|---|
| South Cambridgeshire | £436,011 | +4.9% |
| Cambridge city | £471,098 | −1.2% |
| Cambridgeshire county | £336,451 | +3.1% |
| East of England | £338,707 | +1.1% |
| England | £293,262 | +1.8% |
That pattern flipped during 2026. A year ago the cheaper areas were growing fastest and South Cambridgeshire was barely moving. On the June figures the district has outpaced the county, the region and England, while Cambridge city is the only Cambridgeshire district still falling.
What it means for you
If you are selling, the village-level figures above matter more than the district average when you set a price, and a single strong month is not a trend: the index is provisional and the district is still below its September 2025 peak. If you are buying, the useful arbitrage is between villages: the same budget that buys a terrace in Great Shelford buys a detached house in Cambourne, and both ends of the district have a station or busway link to Cambridge and London. And if you are weighing a new-build on one of the district’s big sites, from Northstowe to Waterbeach, the pipeline of thousands of new homes in the Local Plan is part of why price growth here is slower than the national average.
Frequently asked questions
What is the average house price in South Cambridgeshire?
The average home in the district sold for £436,011 in June 2026, according to the UK House Price Index built from HM Land Registry completed sales. Individual villages range from about £381,000 (Cambourne) to £891,000 (Great Shelford).
Are South Cambridgeshire house prices rising or falling?
Rising: up 4.9% in the year to June 2026, or £20,457. Semi-detached and terraced homes rose most, both 5.8%, while flats rose 2.9%. Cambridge city prices fell 1.2% over the same year. The district average is still £15,890 below its September 2025 record.
Which is the most expensive village in South Cambridgeshire?
Of the villages with enough sales to measure, Great Shelford leads by a wide margin at an average of £890,632 over the year to August 2026, with detached homes there averaging more than £1.5 million.
Where is the cheapest place to buy in the district?
Cambourne, at an average of £380,569. Its modern estates give it the youngest and most uniform housing stock in the district, and prices there eased 5% over the past year.
Is South Cambridgeshire cheaper than Cambridge?
Yes, but by less than it was. The district average of £436,011 is £35,087 below Cambridge city’s £471,098, down from a £61,040 gap a year earlier. Both sit well above the county, regional and national averages.
Where can I check what a specific house sold for?
Every completed sale in England and Wales is public. Search a street or address free on the HM Land Registry Price Paid service, or browse the same data on Rightmove and Zoopla.
Sources
- UK House Price Index, South Cambridgeshire (ONS / HM Land Registry) for the district average, property-type, buyer-type and comparison figures, June 2026 release, published 19 August 2026.
- Rightmove sold prices for the village-level averages (Great Shelford, Histon, Melbourn, Comberton, Sawston, Linton, Waterbeach, Cambourne pages), year to August 2026.
- HM Land Registry Price Paid search to look up any individual address.
UK HPI figures are provisional and revised as more sales complete. Checked August 2026; always confirm the latest month against the linked sources.
Have your say