
The district average reached £439,573 in July, up £9,516 in a year but still below last September. Flats are worth less now than in July 2017.
The average South Cambridgeshire home sold for £439,573 in July. That is £9,516 more than a year earlier, a rise of 2.2%.
It is also £11,276 below where the district was ten months ago. In September 2025 the average here hit £450,849, the highest figure the index has ever recorded for South Cambridgeshire. Prices have not got back to it.
The figures come from the UK House Price Index, which HM Land Registry published on 16 September. It is built from completed sales, not asking prices, and it reports a mean average, not a median. A handful of large village sales pull it up in a way a median would not.
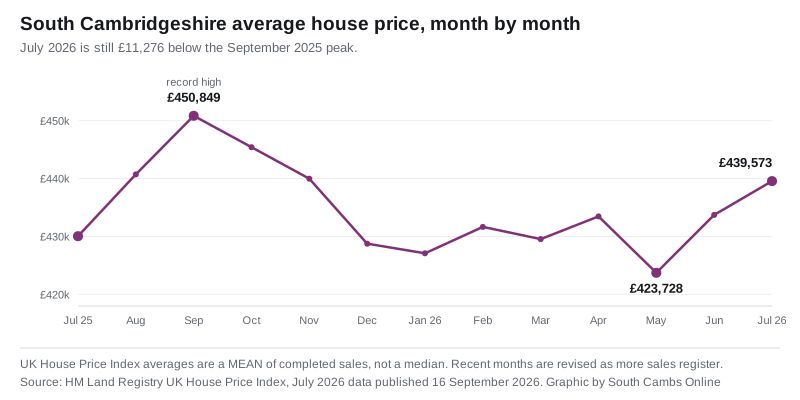
The low point of the past year was May, at £423,728. Two months of recovery have added £15,845 to the average since then.
Flats are the outlier, and they are going backwards
Three of the four property types rose over the year. One did not.
| Type | July 2026 | Annual change |
|---|---|---|
| Detached | £636,197 | up 1.8% |
| Semi-detached | £403,783 | up 3.2% |
| Terraced | £329,171 | up 2.8% |
| Flat or maisonette | £199,495 | down 0.9% |
The average South Cambridgeshire flat is now worth £199,495. In July 2017 it was £208,387. On these figures a flat in the district is £8,892 cheaper than it was nine years ago, before any account is taken of what money was worth then.
Flats are also the reason the headline number keeps stalling. The district’s flat average peaked at £209,768 in September 2025 and has fallen £10,273 since.
Cambridge has stood completely still
Next door, the city average was £475,151 in July. Twelve months earlier it was £475,119.
That is a change of £32 in a year, and the index records Cambridge’s annual movement as 0.0%.
The practical effect is that the gap between the city and the villages keeps closing:
- July 2025: Cambridge £475,119, South Cambridgeshire £430,057, a gap of £45,062
- July 2026: Cambridge £475,151, South Cambridgeshire £439,573, a gap of £35,578
The saving from moving out of Cambridge has shrunk by £9,484 in a year.
Where the district sits in Cambridgeshire
South Cambridgeshire is the second dearest place to buy across Cambridgeshire and Peterborough. Only two areas grew more slowly over the year, and both of them are cities.
| Area | July 2026 | Annual change |
|---|---|---|
| Cambridge | £475,151 | 0.0% |
| South Cambridgeshire | £439,573 | up 2.2% |
| East Cambridgeshire | £346,413 | up 5.8% |
| Huntingdonshire | £308,374 | up 3.1% |
| Peterborough | £234,690 | down 0.2% |
| Fenland | £225,613 | up 3.1% |
For comparison, England as a whole rose 1.1% to £293,479 and the East of England rose 0.5% to £337,518. The district is growing at twice the national rate, but from a base that is £146,094 higher.
Three and a half years of almost nothing
The index is set so that January 2023 equals 100. South Cambridgeshire’s July 2026 reading is 102.9.
In plain terms, the average home here is worth 2.9% more than it was in January 2023. That is £12,516 across three and a half years, from £427,057 to £439,573.
A correction to our June figure
When we reported the June figures on 23 August, the index put the district average at £436,011. Land Registry has since revised that month down to £433,733, a cut of £2,278.
The revision also changes the June rise we reported. What was published as a 2.9% jump in a single month is now recorded as 2.4%, and the annual figure for June has moved from 4.9% to 4.4%. Our June article has been given a dated note. Land Registry revises recent months as more completed sales are registered, so the same is likely to happen to July’s £439,573.
What it means for you
- If you are selling a flat, the index says the market has been against you for a decade. Price against recent completed sales, not against 2025 asking prices.
- If you are buying a first home, the district’s first-time buyer average is £349,026, against £245,515 for England. That is £103,511 more.
- If you are moving out of Cambridge to save money, the arithmetic is weaker than it was. The gap is now £35,578 and shrinking by roughly £9,500 a year.
- If you are checking your own street, the index is a district-wide mean. A single village can move completely differently.
- Revisions matter. Any figure for the last three months should be treated as provisional.
Our standing page on South Cambridgeshire house prices has the longer picture, and council tax bands has what each band costs by parish. For the previous release, see June’s figures.
Have your say