
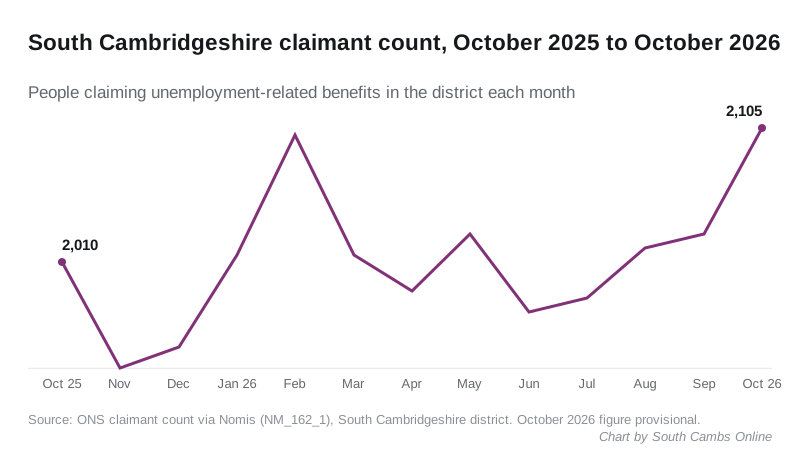
2,105 people in South Cambridgeshire claimed unemployment benefits in October, the most since 2021. The rise was the biggest of any Cambridgeshire district.
Overview
2,105 people in South Cambridgeshire were claiming unemployment-related benefits in October. That is the highest monthly count since October 2021, when it stood at 2,140. (ONS claimant count via Nomis)
The count rose by 75 in a month, from 2,030 in September. It is 95 higher than a year earlier, when it was 2,010. The October figure is provisional and can be revised next month.
It is still a small share of the district. Claimants make up 2.0% of residents aged 16 to 64, the lowest rate of the five Cambridgeshire districts.
Who is claiming
The rise came from people aged 25 and over. The number of 16 to 24 year olds claiming did not move.
| Age group | September 2026 | October 2026 | Change |
|---|---|---|---|
| 16 to 24 | 385 | 385 | 0 |
| 25 to 49 | 1,115 | 1,160 | +45 |
| 50 and over | 535 | 560 | +25 |
| All ages | 2,030 | 2,105 | +75 |
The 560 claimants aged 50 and over are the most in that age group since August 2021. (Nomis, by age)
The age figures are rounded to the nearest five, so they do not always add up to the total.
How the rest of Cambridgeshire compares
South Cambridgeshire had the largest rise in October of the county’s five districts.
| District | September 2026 | October 2026 | Change | Share of 16 to 64s |
|---|---|---|---|---|
| South Cambridgeshire | 2,030 | 2,105 | +75 | 2.0% |
| Fenland | 2,365 | 2,425 | +60 | 3.9% |
| Cambridge | 2,260 | 2,305 | +45 | 2.1% |
| Huntingdonshire | 2,650 | 2,695 | +45 | 2.3% |
| East Cambridgeshire | 1,210 | 1,245 | +35 | 2.2% |
Every district went up. Fenland’s rate is close to twice South Cambridgeshire’s.
The villages with the most claimants
Cambourne has the most claimants of the district’s 26 wards, at 250. It is also the district’s largest settlement, so the numbers below partly follow the size of each place.
| Ward | September 2026 | October 2026 |
|---|---|---|
| Cambourne | 240 | 250 |
| Milton and Waterbeach | 170 | 180 |
| Histon and Impington | 175 | 170 |
| Longstanton | 120 | 140 |
| Fen Ditton and Fulbourn | 135 | 135 |
| Harston and Comberton | 110 | 120 |
| Over and Willingham | 115 | 110 |
| Cottenham | 105 | 100 |
Longstanton ward had the biggest rise of any ward, up 20. (Nomis, by ward)
Ward figures are rounded to the nearest five. Small changes in a single ward can be rounding rather than a real shift.
What it means for you
The claimant count is the number of people receiving Jobseeker’s Allowance, plus those on Universal Credit who are required to look for work. It is not the same as the unemployment rate. Some people out of work do not claim, and some people on Universal Credit who are in low-paid work are counted.
If you have lost work or your hours have been cut, you can check whether you can claim Universal Credit on GOV.UK.
The district still has the lowest claimant rate in Cambridgeshire. Its full-time workers are also the best paid in the county, according to the ONS pay survey for 2026.
Sources: ONS claimant count, South Cambridgeshire district, via Nomis. Figures for October 2026 are provisional.
Have your say